Cinebench: How to Measure Hardware Performance During Rendering
Cinebench is a hardware evaluation benchmark especially popular in the 3D rendering sphere. It is developed by Maxon, who also developed the 3D modelling suite Cinema 4D and GPU renderer Redshift. Major CPU producers like Intel and AMD use Cinebench scores as a goal and proof of the quality of the new top-of-the-line models. At Megarender, we use these scores as a basis for our calculator to help you determine the costs of your future projects.
How to use it
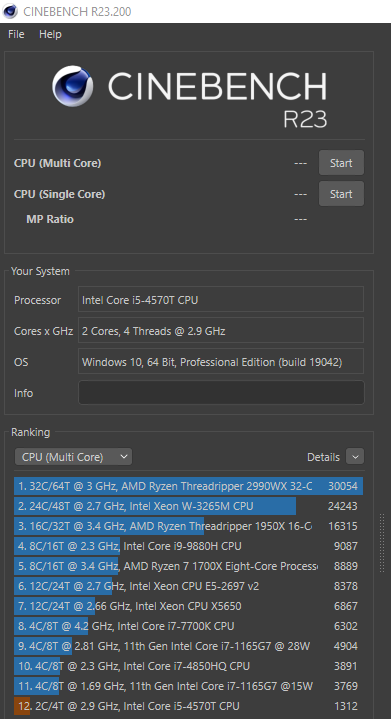
Download Cinebench R23 from the official website - it is free and doesn’t require you to sign up. Unzip the archive onto your system drive and launch the Cinebench.exe file. On the left side of the screen you can see your system’s characteristics that the benchmark determines automatically. They may be empty or differ from reality if you’ve manually changed the specs or overclocked your CPU. Under them there is a list of Cinebench scores for a selection of popular and powerful CPUs.
|
You can see that Threadripper 2990 WX has a whopping score of over 30,000 points. Meanwhile, our office PC got a result of mere 1,312 points. This is enough to work with internet browsers and simple applications, but definitely not for rendering. |
To run the test:
-
Before starting, make sure to close all running applications. Any launched software takes up the processor’s resources and detracts from the final score.
-
Сlick ‘Start’ next to CPU (Multi Core) or CPU (Single Core) to start the testing.
-
An image will start rendering in the app window. Each square represents a single thread of your CPU.
-
The test will run for 10 minutes, and then continue until the image rendering is done.
-
Your Cinebench R23 score will appear on the same line next to the button.
You can access more settings through the Advanced benchmark or Preferences options in the Files menu in the top-left corner. These settings are mostly used to set up the minimum time the rendering will run for, or to turn off the limit to run the test only once (this can be useful if you need a fast check).
What do R15, R20 and R23 mean?
So you’ve downloaded the program from the official website, ran the test a couple of times and decided to compare your results to others. As you search online, you realize there are multiple tables of different values for CB R15, CB R20, and even CB R11.5, but not as many for R23. Are they even different?
R23 is the latest version of Cinebench, released in November 2020. Previous releases can still be found for download, but be prepared that the values will differ from the results you have for R23. Maxon has been updating the benchmark through the years to reflect the progress done in CPU development.
R11.5 and R15 tests take mere seconds to complete on a Threadripper or a Core i9 processor; such a short time period leads to unreliable results. Therefore, R23 provides the most accurate evaluation. It runs the tests for a minimum of 10 minutes by default. This simulates the conditions in which CPUs are usually operating during the rendering. This way you can make sure that the cooling systems work properly and there is no overheating. It also gives time for all the CPU cores to become fully loaded.
Finally, unlike many other benchmarks, Cinebench tests the CPU performance specifically for 3D rendering. This is why the scores are important when you are searching for a new workstation or buying a separate computer to use as a render farm.
Application at Megarender
Cinebench R15 and R20 scores are used at the core of our calculator to help to evaluate the cost of a future project as accurately as possible. We know the scores for our processors, and use this as a baseline to determine how one minute of rendering on your computer compares to the time on our render farm.
We have assembled a database of cinebench scores for most of the popular processors currently in use, so you don’t have to run the tests on your own. However, if you use overclocking or tweak your BIOS or RAM settings, we advise you to determine your CR 20 score following these instructions. It will guarantee the closest result to reality and prevent any unpleasant surprises.
TOP 20 Cinebench R23 results
|
CPU model |
Amount |
Power, |
Multi |
Single |
|---|---|---|---|---|
|
AMD Threadripper 3990X |
64 |
2.9 |
75671 |
1262 |
|
AMD Threadripper Pro 3995WX |
64 |
2.7 |
73220 |
1231 |
|
AMD Epyc 7702P |
64 |
2.0 |
48959 |
993 |
|
AMD Threadripper 3970X |
32 |
3.7 |
46874 |
1308 |
|
AMD Threadripper Pro 3975WX |
32 |
3.5 |
43450 |
1244 |
|
AMD Threadripper 3960X |
24 |
3.8 |
34932 |
1307 |
|
AMD Threadripper 2990WX |
32 |
3.0 |
29651 |
1005 |
|
AMD Ryzen 9 5950X |
16 |
3.4 |
28782 |
1684 |
|
Intel i9 9980XE |
18 |
3.0 |
27093 |
1114 |
|
AMD Ryzen 9 3950X |
16 |
3.5 |
26375 |
1406 |
|
Intel i9 10980XE |
18 |
3.0 |
25490 |
1063 |
|
AMD Ryzen 9 5900X |
12 |
3.7 |
22046 |
1670 |
|
AMD Threadripper 1950X |
16 |
3.4 |
19635 |
1027 |
|
AMD Threadripper 2950X |
16 |
3.5 |
18797 |
1135 |
|
AMD Ryzen 9 3900X |
12 |
3.8 |
18682 |
1312 |
|
AMD Ryzen 9 3900XT |
12 |
4.1 |
18522 |
1354 |
|
Intel i9 10900K |
10 |
3.7 |
18034 |
1415 |
|
Intel i9 9960X |
16 |
3.1 |
17953 |
1075 |
|
Intel i9 10850K |
10 |
3.6 |
16820 |
1367 |
|
Intel i9 11900K |
8 |
3.5 |
16211 |
1671 |